Automated Benchmarking for Virtualization: How We Optimize System Performance with Nix and WFVM
In this blog post, we dive into how our team leverages advanced benchmarking techniques to ensure optimal performance across diverse systems, from Linux to Windows, using a mix of micro-benchmarks and real-world performance tests. We explain how automation through tools like Nix and WFVM allows us to streamline benchmarking across various hardware setups and integrate these processes directly into our CI pipelines. Our detailed dashboards track performance over time, giving us the insight needed to maintain and improve product quality.
Last updated:
Florian Pester
Program Manager CTRL-OS
In our daily work on virtualization solutions we often have the need to benchmark complete system images, for Linux as well as Windows systems. In that manner it is important to us to automate those benchmarks as much as possible and to make sure they run as part of our Continuous Integration (CI) pipelines.
We run a set of different benchmarks — anything from micro-benchmarks to measure a single aspect of the system to real-world benchmarks that mimic how users would interact with the system and measure how well the systems performs in those scenarios.
An example for a micro-benchmark would be CrystalDiskMark, that has a focus on measuring I/O performance or the Unigine Heaven and Valley benchmarks that focus on graphics performance. Examples for real-world benchmarks would be the Procyon benchmark with a focus on office workloads or the Geekbench.
With a whole number of different operating systems (and versions), even more benchmarks and high variability in hardware platforms, the number of combinations becomes huge quite quickly. In order to manage the sheer number of benchmarks we have built a set of helpful tools to automate running benchmarks and comparing performance.
In order to have a useful and efficient setup we need to do three things:
Build system images for all benchmarks and all systems
Run all the images on all hardware we are interested in
Collect the results and create nice dashboards that show we are improving (hopefully!)
We’ll show how we approach each of these steps in our own testing with an example in the remainder of this post.
Automating Windows Benchmarks with Nix and WFVM
Nix is a tool to declaratively make reproducible and reliable systems (just what we need to build efficient benchmark tooling). It is a language, build system and package manager and forms the basis of the popular NixOS Linux distribution.
WFVM is a Nix library to create virtual machines running Windows and enables us to declaratively define Windows Images, for instance we can define a Windows 11 image that has a certain version of Crystal Disk Mark installed. Once we have the code checked into our repository we can build the image as part of our CI pipeline.
Once you have WFVM up and running we can expand it with a layer for our benchmark. The definition may be more involved for more complex setup routines, but the basic idea is the same, we define the source of the benchmark and its hash and we write a script for how to install the benchmark in the Windows image:
{
    cdm =
      let
        benchmarkFiles = builtins.fetchurl {
          name = "CDM Files";
          url = "https://sourceforge.net/projects/crystaldiskmark/files/8.0.5/CrystalDiskMark8_0_5.exe/download";
          sha256 = "c438c644469c4221ff3014a31196e175f5548f07526ece87238cb0daebc9c119";
        };
      in
      {
          name = "CDM";
          script = ''
            ln -s ${benchmarkFiles} ./benchmark.exe
            win-put benchmark.exe .
          '';
      };
}
With the layer defined we can now create the image. We need to specify the base image we want to use and our Windows product key. We also need to define that we want an EFI installation (for earlier versions of Windows we could also use legacy mode). Thanks to WFVM the definition boils down to just a few lines of Nix code:
This will give us an ISO image containing our benchmark ready for execution. We could try this out manually, e.g., in Qemu.
Now all that is left to do is execute the benchmark on all available hardware and plot the results over time, so we learn whether our performance improves over time.
Optimizing Performance Across Hardware: Running Benchmarks Efficiently
With our history of building virtualization solutions and our CIdoka philosophy we have built up a powerful system to enable on-hardware testing. We have written about that system in more detail in a past blog post.
We use that system, to run our benchmarks on a collection of hardware that is important to our customers and a bit of hardware that is interesting to our own future development, or because we use it as developer laptops.
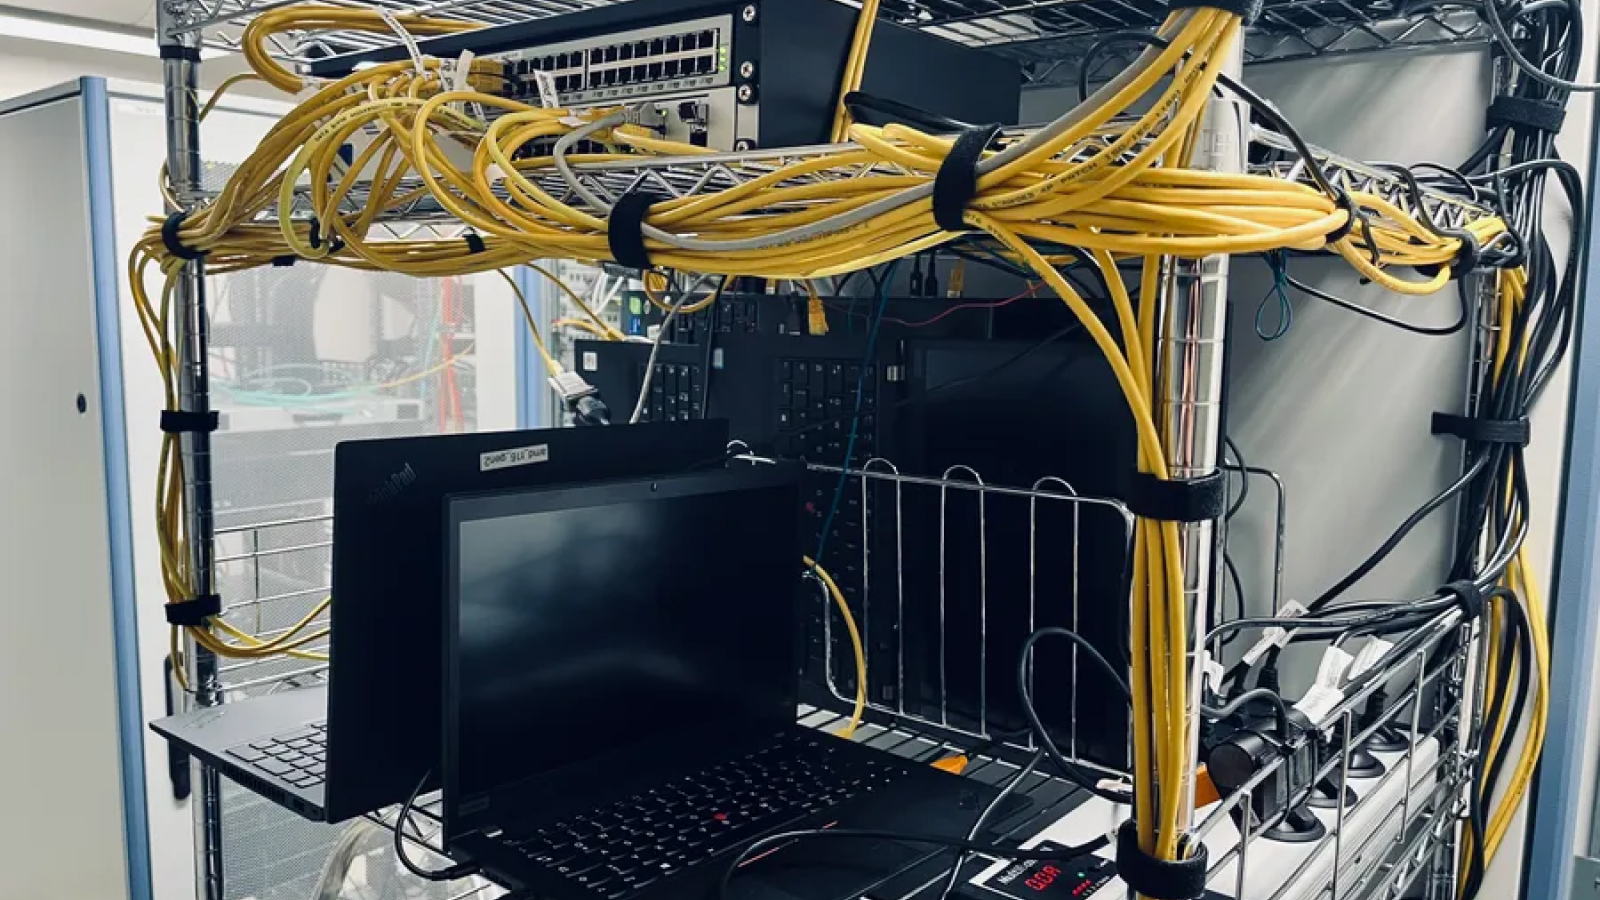
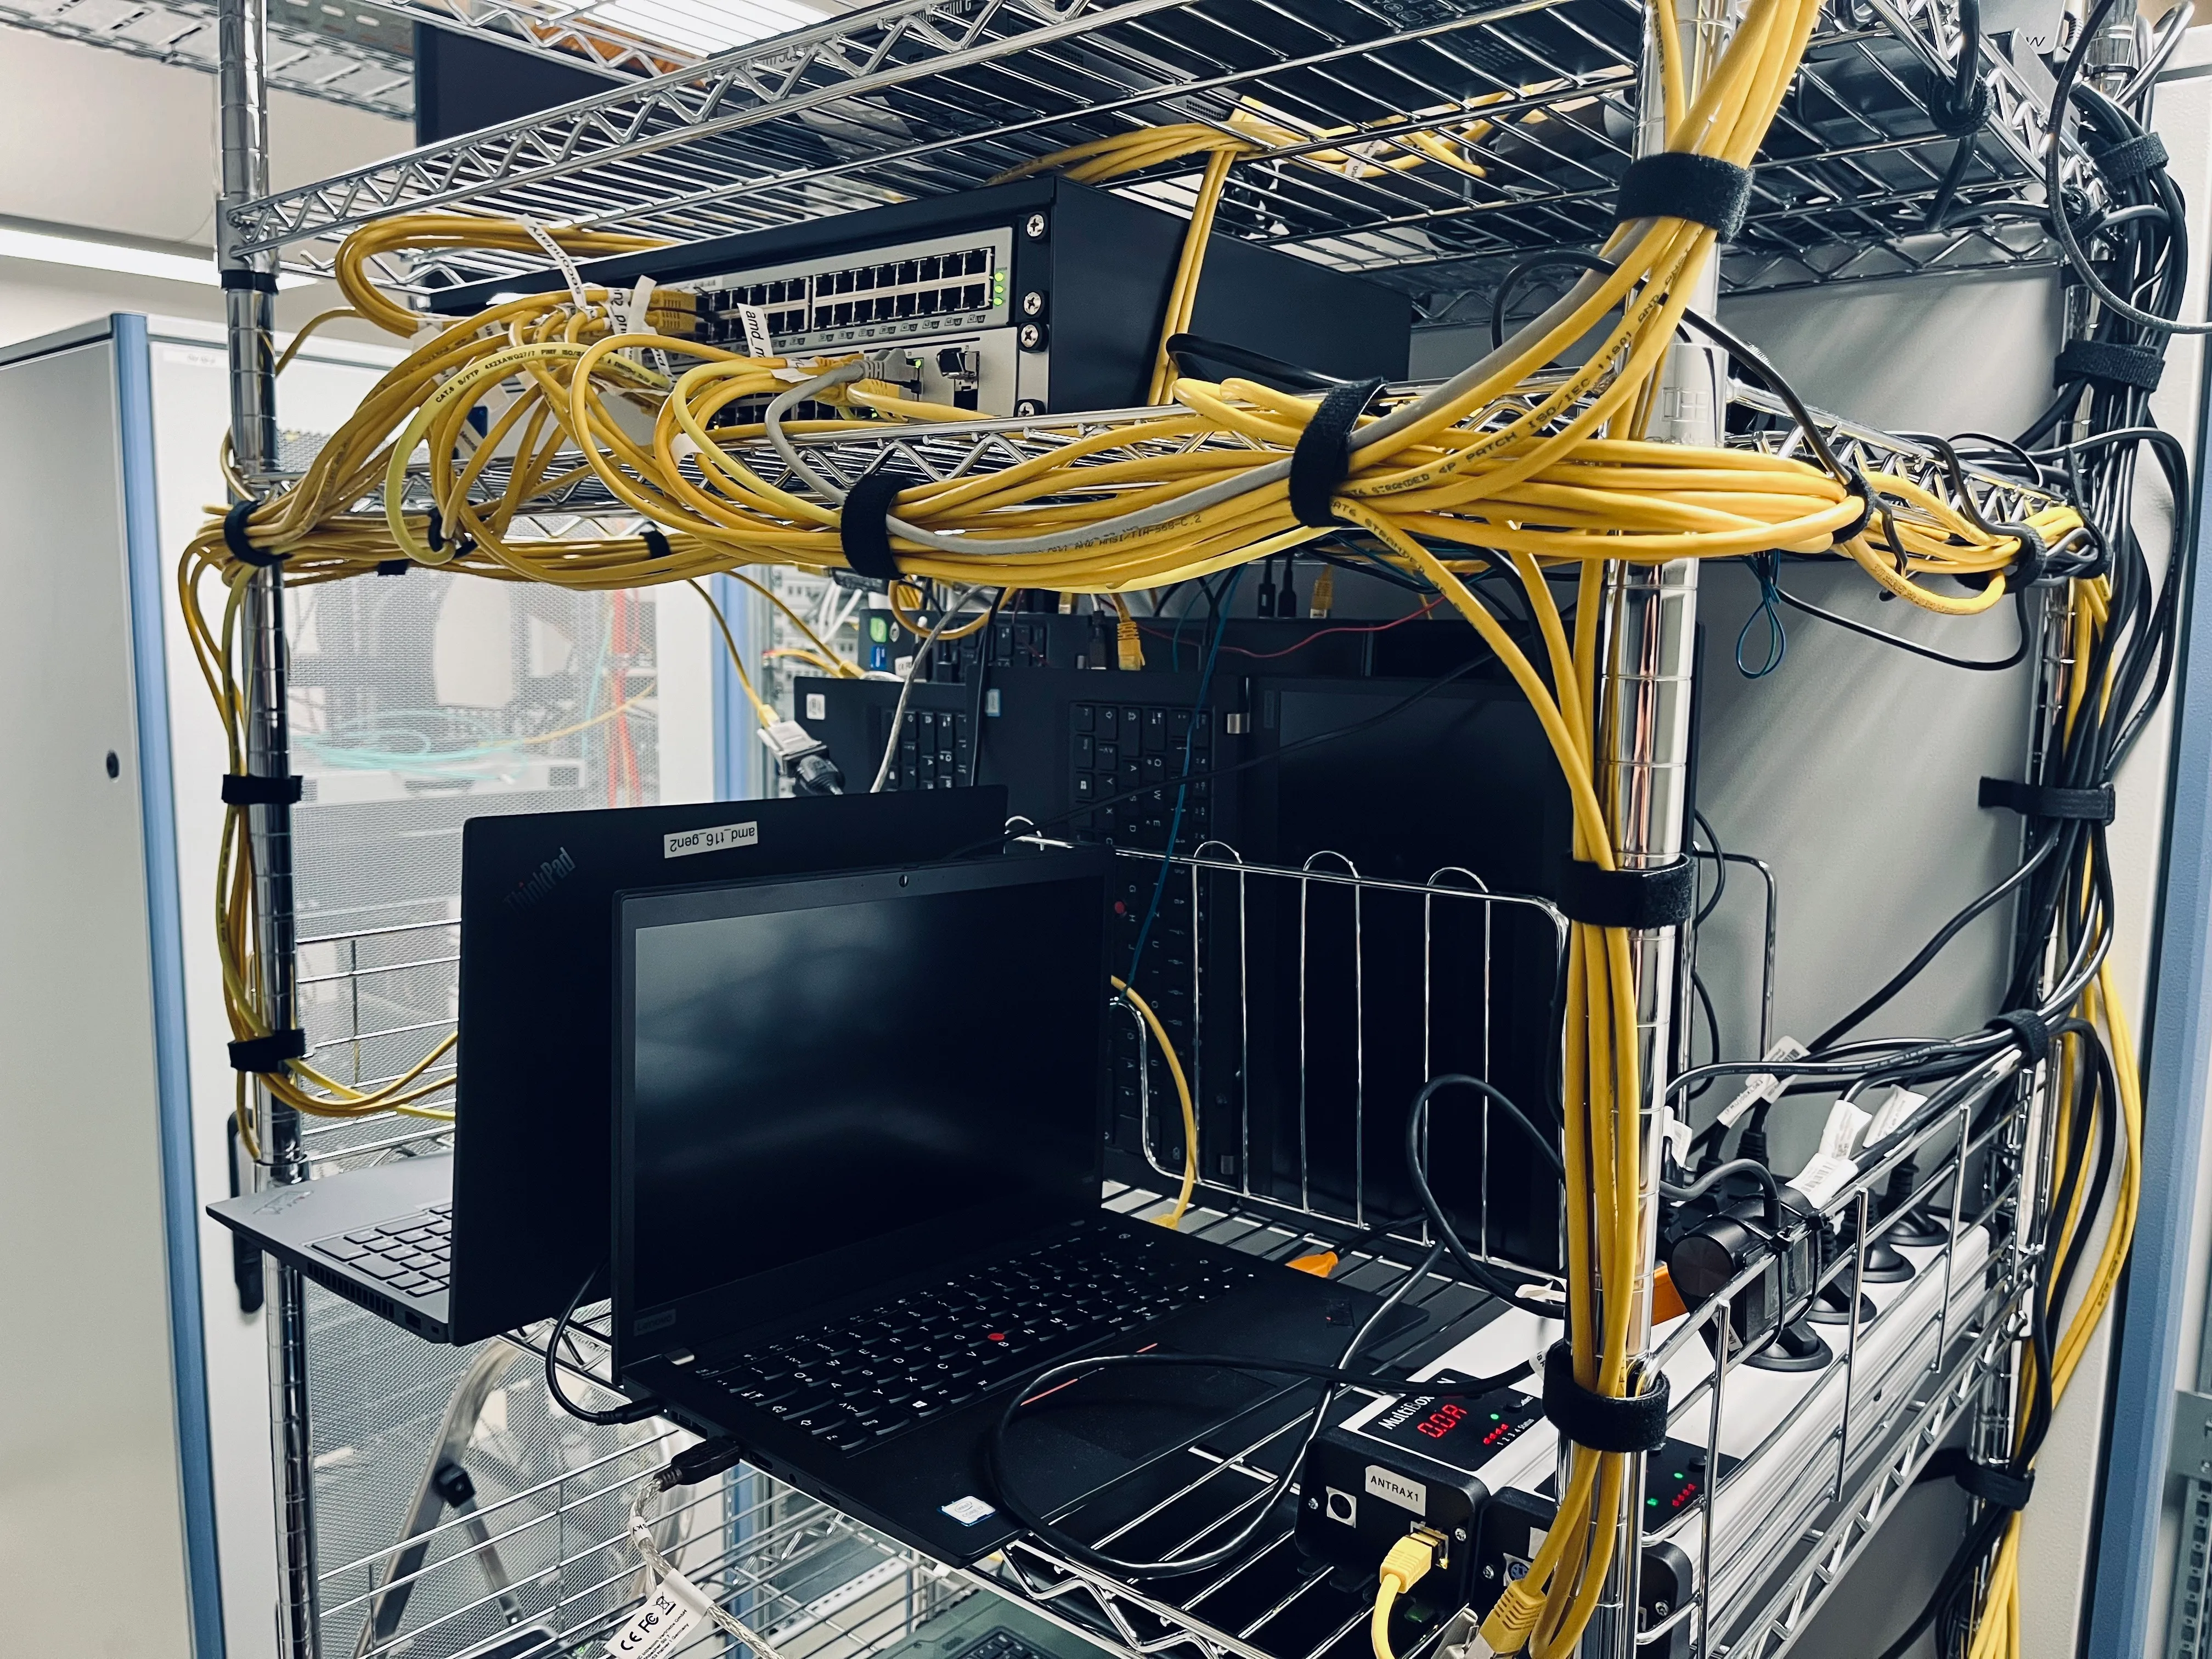
Image: A part of our test rack, that controls various laptops
In principle we have Nix build jobs that create a minimal network bootable host image. Since changes to this image are not too frequent it is usually cached. Our test controller then boots the needed hardware, either by triggering a power socket, via AMT or via our own custom interface (if all else fails).
Once our minimal host image is booted it loads the test description and all the moving parts, such as our Hypervisor and guest images, and the benchmarking payload via network from an artifact repository.
Finally the benchmark runs and records all its results in the guest systems console. Once the benchmark is finished the guest image reports all results back to the central controller.
Leveraging Benchmark Dashboards to Drive Performance Optimization
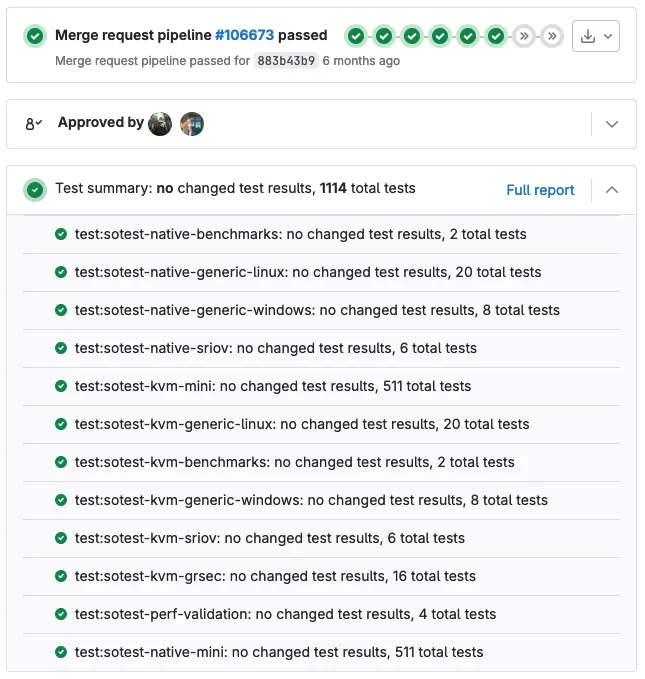
Our central test controller now collects the results into its own database and marks all benchmark runs as successful. This is important, so that the CI pipeline is marked as green and merges can go ahead.
The image above shows how we integrated our testing and benchmarking tool into GitLab. All results and a test summary is reported back to GitLab and can be viewed within a merge request. If more information is required it is easily accessible with a single click. If deemed important this is the place where you could define quality gates to ensure that performance never decreases, but that process goes far beyond the scope of this blog post.
However what we want is a long-term view of how our performance develops over time. We also want to have an illustration that allows us to spot surprising changes in performance. Sometimes we make changes that should improve performance in specific areas and it is important to verify that performance indeed changes as expected. On the other hand when we implement new features we usually expect no performance impact on the existing system. A quick look at our dashboards helps our engineers and reviewers make sure there are no surprises.
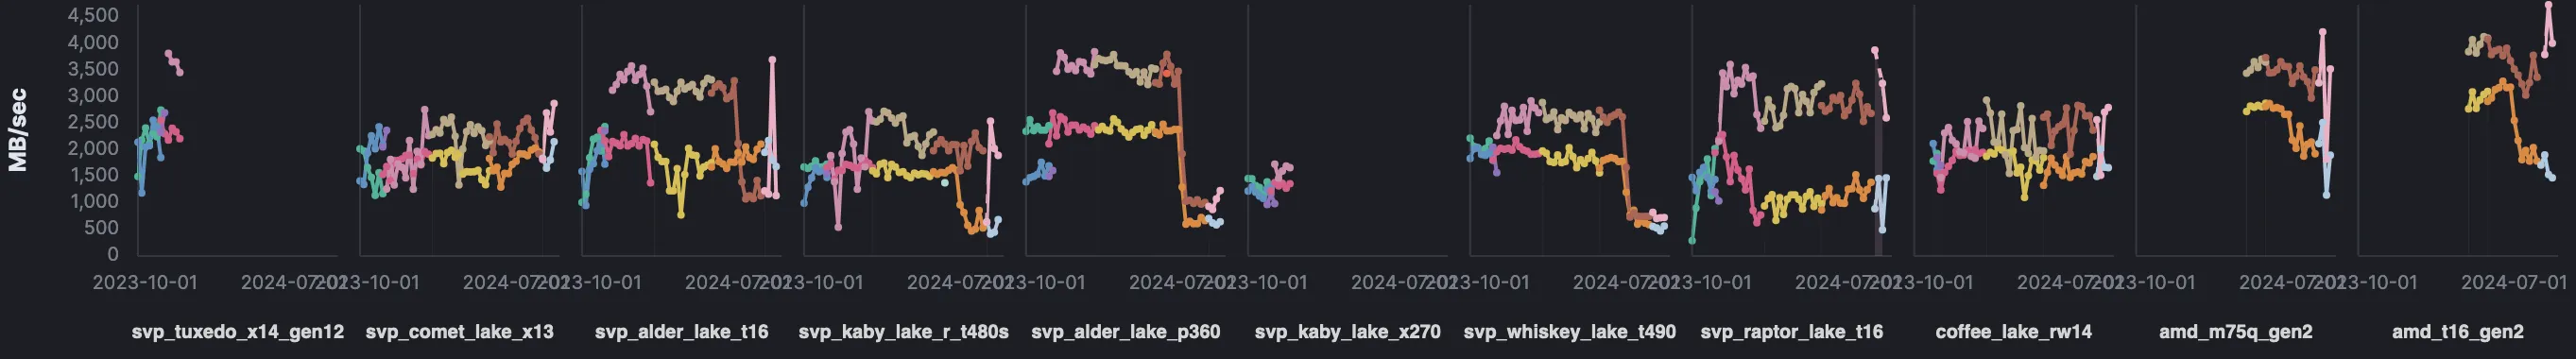
In order to give us observability into our benchmark results our controller also pushes all benchmark results into an Elasticsearch instance. This allows us to create dashboards over the whole spectrum of our benchmarks, operating systems and hardware.
The image shows graphs for disk performance on different types of hardware over the past year. Besides some increases on drops in performance over time you can also see that we change out hardware from time to time. We remove older generations that are not useful any more to make room for new hardware that fits our customer use-cases better.
By automating and scaling our benchmarking process, we’re able to continuously ensure our virtualization solutions meet the highest performance standards, benefiting both our development team and customers. Interested in how we can help optimize your system performance with tailored benchmarking solutions? Contact us today to see how we can apply these insights to your business needs!


.avif)
.avif)